Formerly SyncRoom - now part of the Exalate Console Early Access.
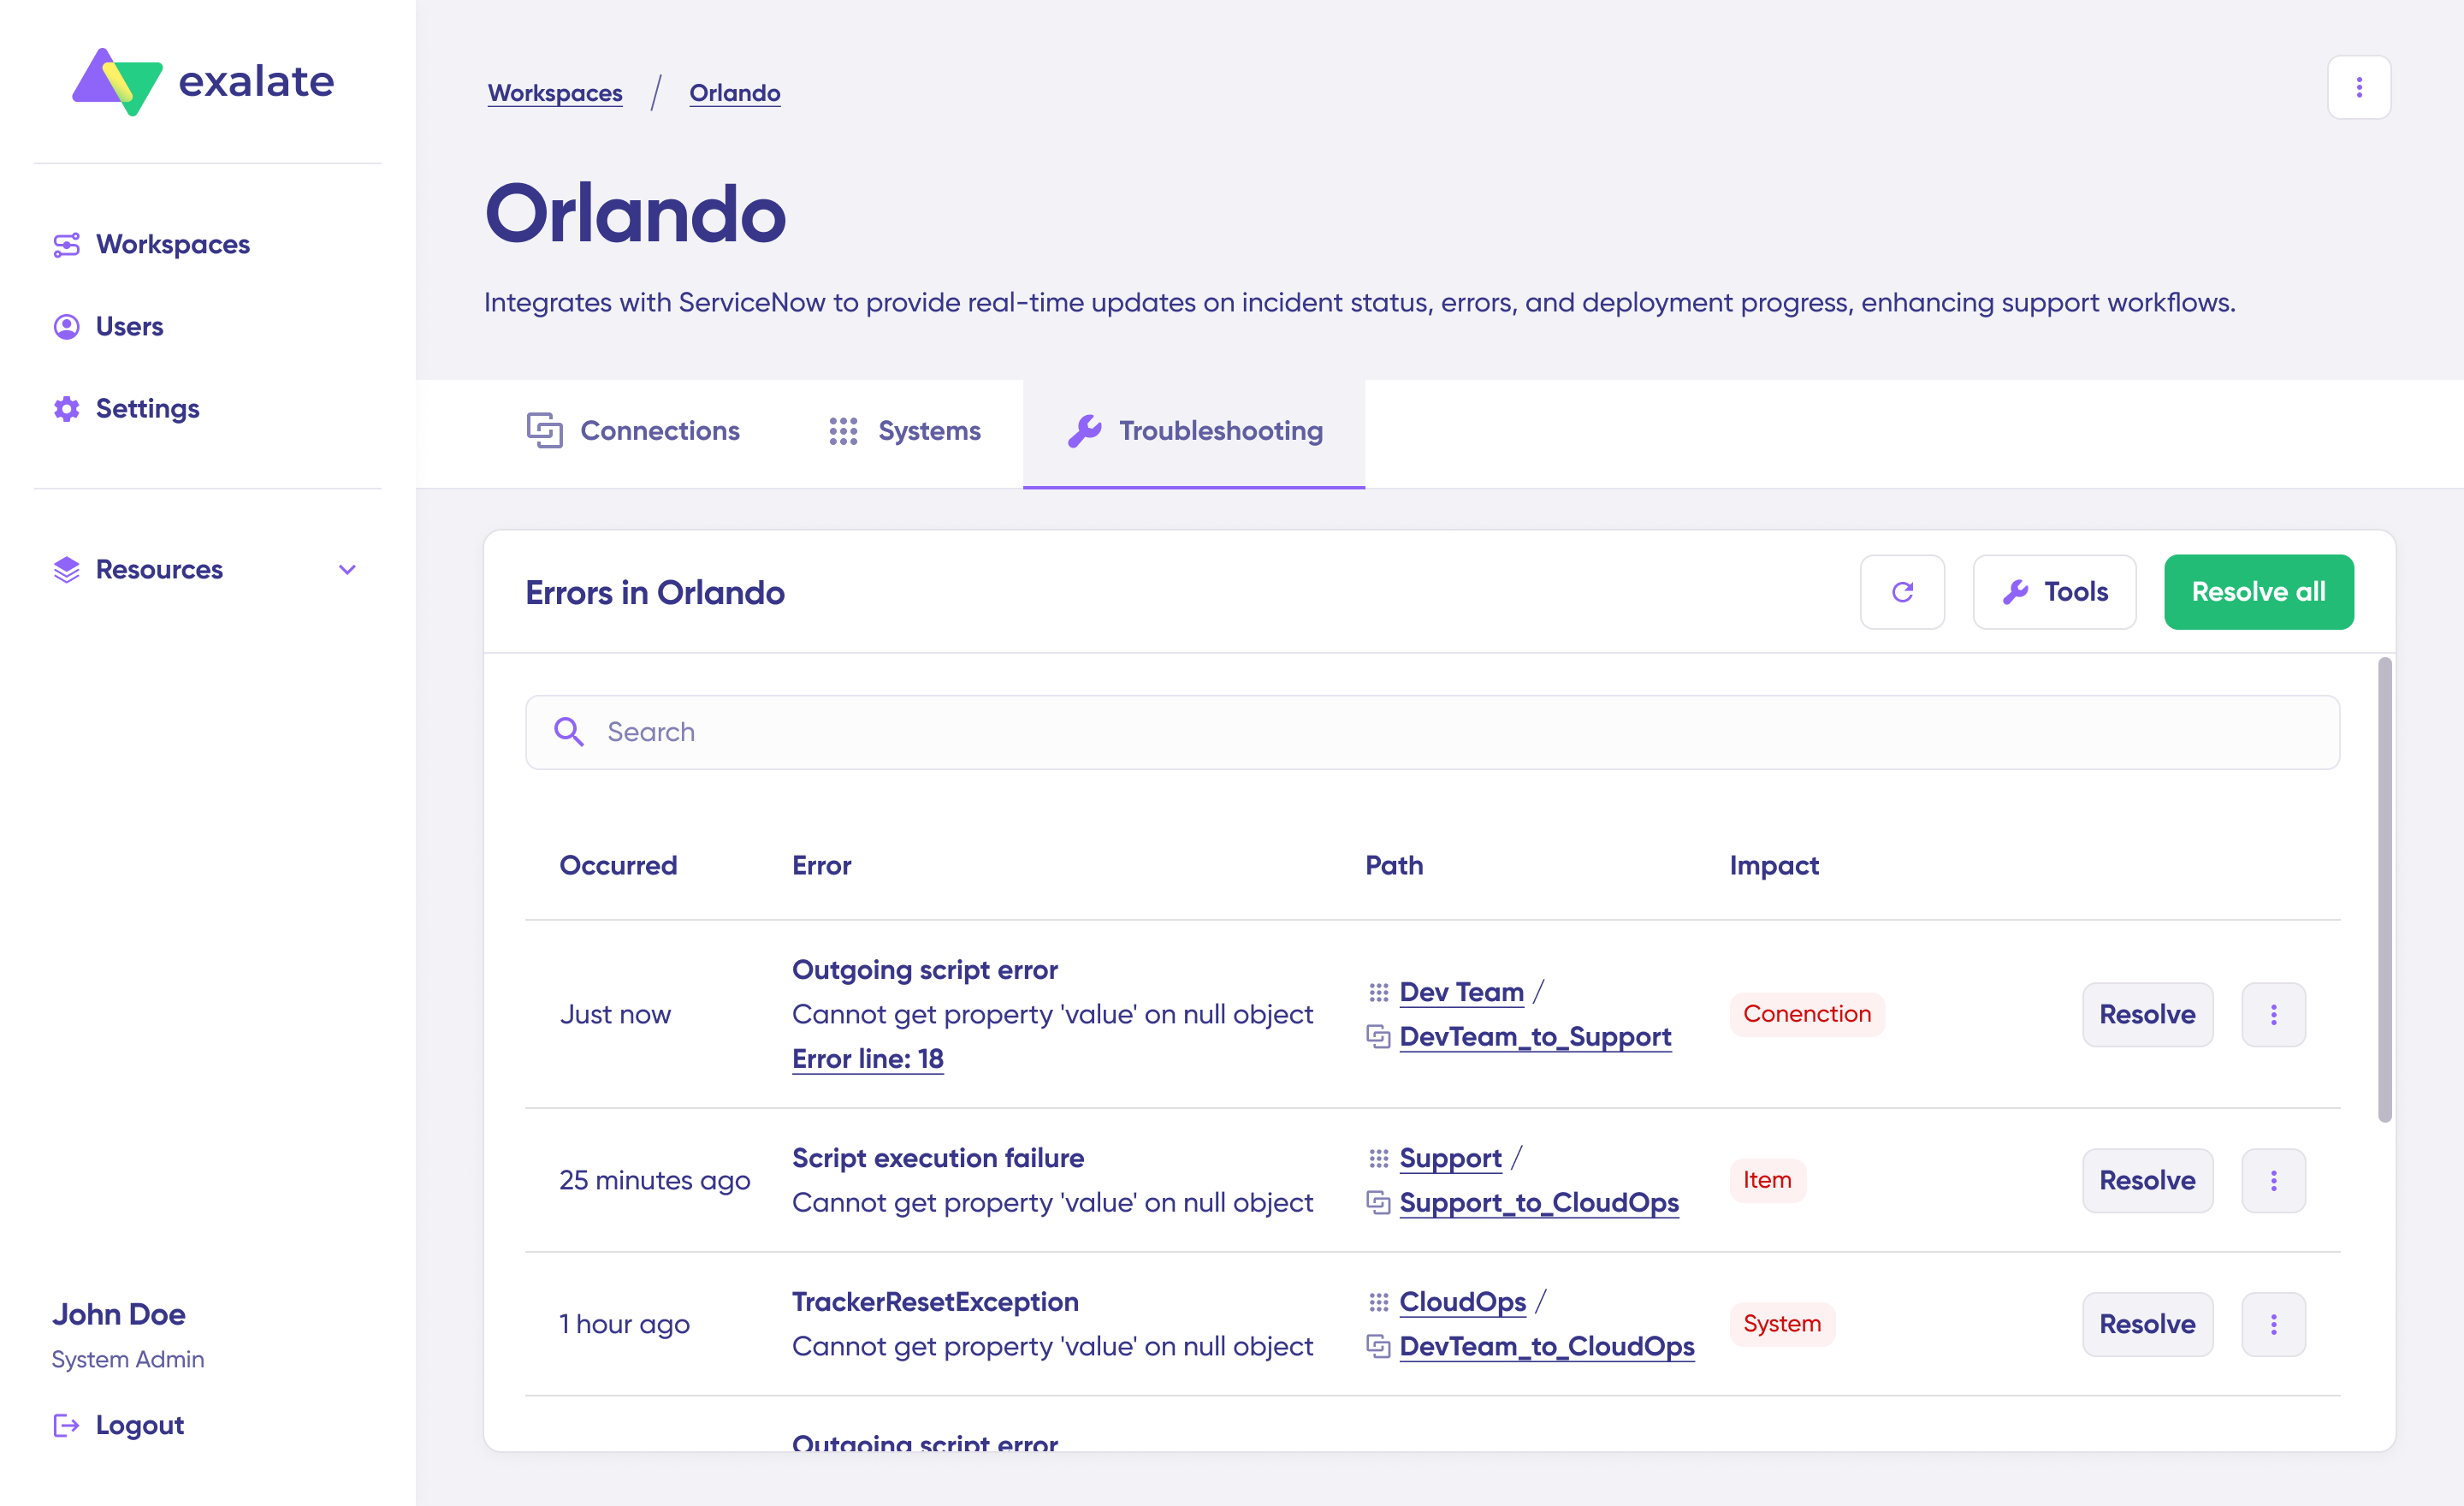
The Troubleshooting tab in new Exalate console allows you to monitor and resolve sync issues across your workspace. Whether it’s a problem on the issue, connection, or system level. All errors are listed in a flat view to help you identify and act on them quickly.
Key capabilities:
View all current sync errors in one place.
Open detailed views to investigate each error.
Use dedicated actions to resolve issues.
Search for specific errors using the search bar.
Get guided troubleshooting with Aida, an AI-powered assistant that suggests next steps and helps resolve errors faster.
Accessing and Searching Errors
To view errors, navigate to any Workspace and open the Troubleshooting tab.
Here you’ll see:
A list of all current errors across the connections in your workspace.
Each error line includes key info like impact level and error type.
A search bar lets you quickly locate a specific error by issue key or message.
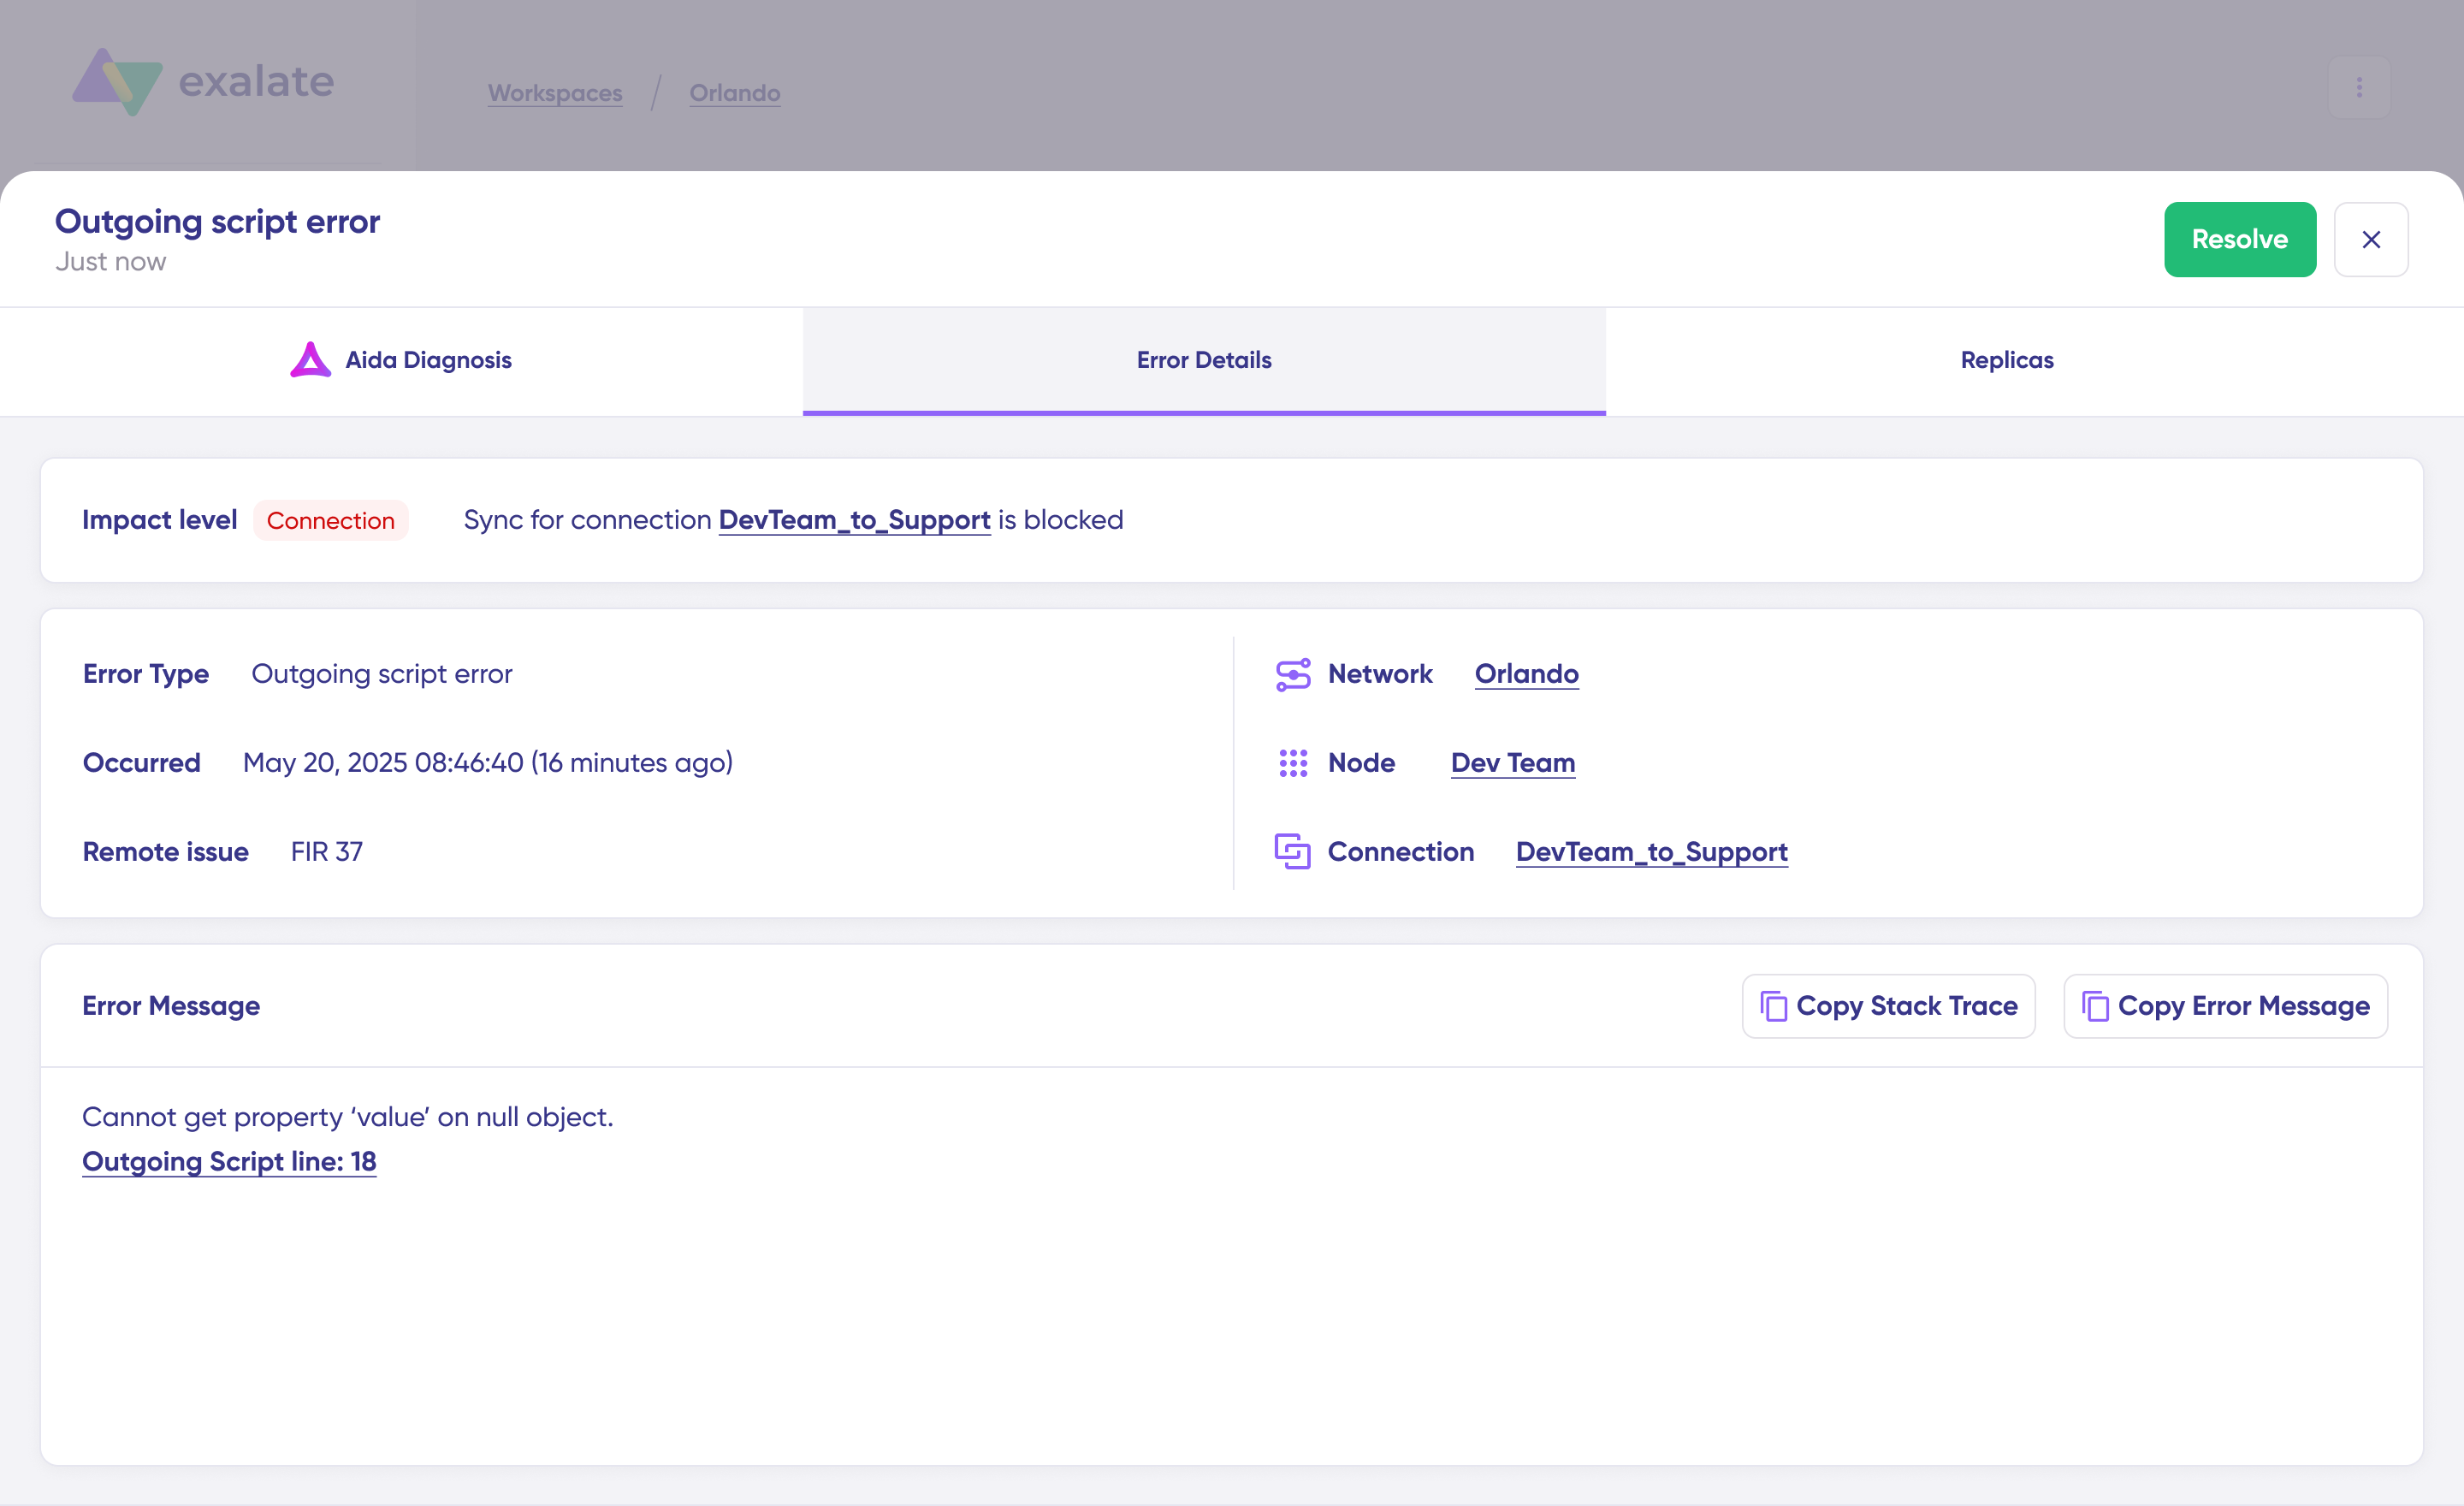
Viewing Error Details
Click on an error row to open the Error Details view. This includes:
Aida Diagnosis: Get AI-powered recommendations for resolving the issue, including possible fixes and next steps.
Error Details: See a clear explanation of what went wrong, along with technical context such as error type and timestamp. Copy full stack trace (if available) via the Copy button in the Error Details panel.
Replicas: Inspect and copy the local and remote issue payloads to help with debugging.
Resolving Sync Errors
Most Errors you'll encounter will require some action, either on the script or on the ticket itself, once you have identified and corrected the root cause of the error there are two ways to resolve them:
Individually: Use the Resolve button next to each error.
In bulk: Use the Resolve All button at the top of the Troubleshooting tab to resolve all listed errors at once.
Selective: Select errors that you want to resolve in bulk and resolve all selected.
Video tutorial
Watch how to diagnose, fix, and resolve sync errors in Exalate, covering the most common issues you may encounter when troubleshooting a connection.